My key takeaways from reading Trustworthy Online Controlled Experiments Book
The implementation of statistics in A/B testing.
Achievement unlocked: Our book is the #1 Best Seller in Data Mining: Trustworthy Online Controlled Experiments: A Practical Guide to A/B Testing (https://t.co/aseJyTKbDh).
— Ronny Kohavi (@ronnyk) June 29, 2021
I'm humbled.#abtesting #hippo #experimentguide pic.twitter.com/5CckQcXnPH
This article contains about A/B testing, make sure the reader understands fundamental concepts about control and treatment, p-values, confidence interval, statistical significance, practical significance, randomization, sample, and population in order to get the idea about A/B testing. You can get the fundamental statistics by looking at this video.

Experimentation/Testing has been everywhere. It is widely adopted by startups to the corporate firm to detect how good the simple or bigger changes of the project or additional feature(be it a website, mobile app, etc.) of the project to give impact to the real-life/business. In Data Science, Experimentation is widely used to predict how good our experimentation is based on a few metrics by using statistical approaches. Online Trustworthy Controlled Experiment is the book I wish I had when I started learning A/B testing/Experimentation. This book covered all the fundamental concepts to advanced concepts about A/B testing through a step-by-step walkthrough such as designing the experimentation, running the experimentation and getting data, interpreting the results and results to decision-making. The author explained clearly the pitfalls and solutions to the problems that could exist during the experimentation.
A step-by-step walkthrough of A/B Testing
Designing The Experiment
The first step of doing online experimentation is to ascertain our hypothesis, a practical significance boundary, and a few metrics before running the experimentation. We should check the randomization of the sample that we will use for the control and treatment. We also should pay attention to how large the sample is to be used for running the experimentation. If we are concerned about detecting a small change or being more confident about the conclusion, we have to consider using more samples and a lower p-value threshold to get a more accurate result. However, If we no longer care about small changes, we could reduce the sample to detect the practical significance.
Getting the Data and Running The Experimentation
In this section, you are going to get some data pertaining to the experimentation that we will be analyzing such as analyzing how many samples should be used, the day of week effect due to everyone having different behavior on weekdays over the weekend, and also seasonality where users behave differently on holiday. We also consider looking at primacy and novelty effects where users have a tendency to use new features,
Interpreting the Results
One thing we should consider when interpreting results is how our experimentation will run properly and avoid some bugs that could invalidate the experiment result(guardrail metrics). For instance, we can check the latency which is essential to check that can affect the control and treatment, or expect the control and treatment sample to be equal to the configuration we set for A/B testing. These factors must be fulfilled to get better results that can affect the metrics we are going to achieve.
From Results to Decisions
Getting a result from the experiment is not the end of the experimentation. Getting a result that can make an impact on the business will be a good way of implementing experimentation. In A/B Testing, good results can be considered good if they are repeatable and trustworthy. However, there are a few factors that should consider regarding whether we need to make a tradeoff between metrics for instance user engagement and revenue. Should we launch if there is no correlation between this metric?. We also consider launching costs whether the revenue will cover the launch cost or get more expected revenue even need much cost to launch the product. Furthermore, We also consider statistical and practical significance thresholds of whether to launch or not launch the product.
Statistical and Practical Significance Thresholds
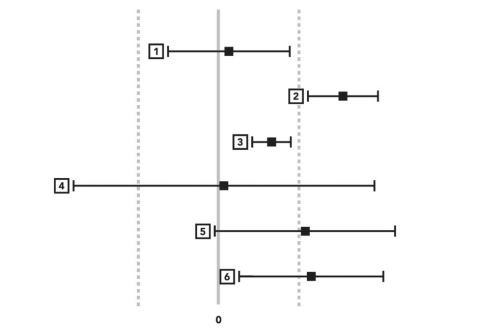
The figure shown above depicts the statistical and practical significance threshold where the two dashed lines are the practical significance boundary and the black box is the statistical significance threshold along with the confidence interval. We know from statistics theory that the statistical significance threshold is less than or equal to 5% to quantify that we should reject the null hypothesis and the practical significance is managed based on the condition of our objective that we wanted to achieve. Based on the practical and statistical significance, we can take a step either choosing to launch or not. However, we can even take a follow-up test to test our hypothesis in order to translate practical and statistical significance boundaries based on some consideration of our experiment to get statistical power(a condition where the p-value is less than(more extreme) or equal to 0.05 implying there is a difference between control and treatment mean assuming the null hypothesis is true).
Conclusion
This book is really essential for every data scientist who specialized in product analytics in order to cover our understanding of data better through A/B testing. You will get a lot of enlightenment after reading this book. Read it, buy it.